PhyloNext v2 web-GUI documentation
1. Introduction
PhyloNext v2 provides a user-friendly web interface for the PhyloTwin biodiversity analysis pipeline. It is an advanced modelling tool designed to calculate and visualize biodiversity metrics, particularly focusing on phylogenetic diversity, using global and dynamic data sources.
Traditional biodiversity measures often rely on taxonomic richness (species counts). However, PhyloNext emphasizes phylogenetic diversity, which considers the evolutionary relationships between species, offering a more comprehensive view crucial for effective conservation planning and biodiversity management. This tool aims to facilitate researchers, monitoring initiatives, policy-makers, and the public in understanding and managing biodiversity.
The PhyloNext interface leverages global species occurrence database provided by the Global Biodiversity Information Facility (GBIF) and synthetic phylogenetic trees from the Open Tree of Life (OToL).
The GUI is hosted at GBIF.org: https://phylonext.gbif.org/
A GBIF.org user account is required: Create account.
2. Core functionality: The PhyloNext pipeline
The PhyloNext web-GUI is powered by the robust PhyloNext pipeline [1,2]. This pipeline integrates global phylogenetic data with species occurrence records, significantly reducing computation time while enhancing user interaction. Key benefits include:
- Flexible processing and analysis workflows.
- Dynamic visualization of biodiversity patterns.
- Interactive comparative analysis capabilities (currently in the test stage).
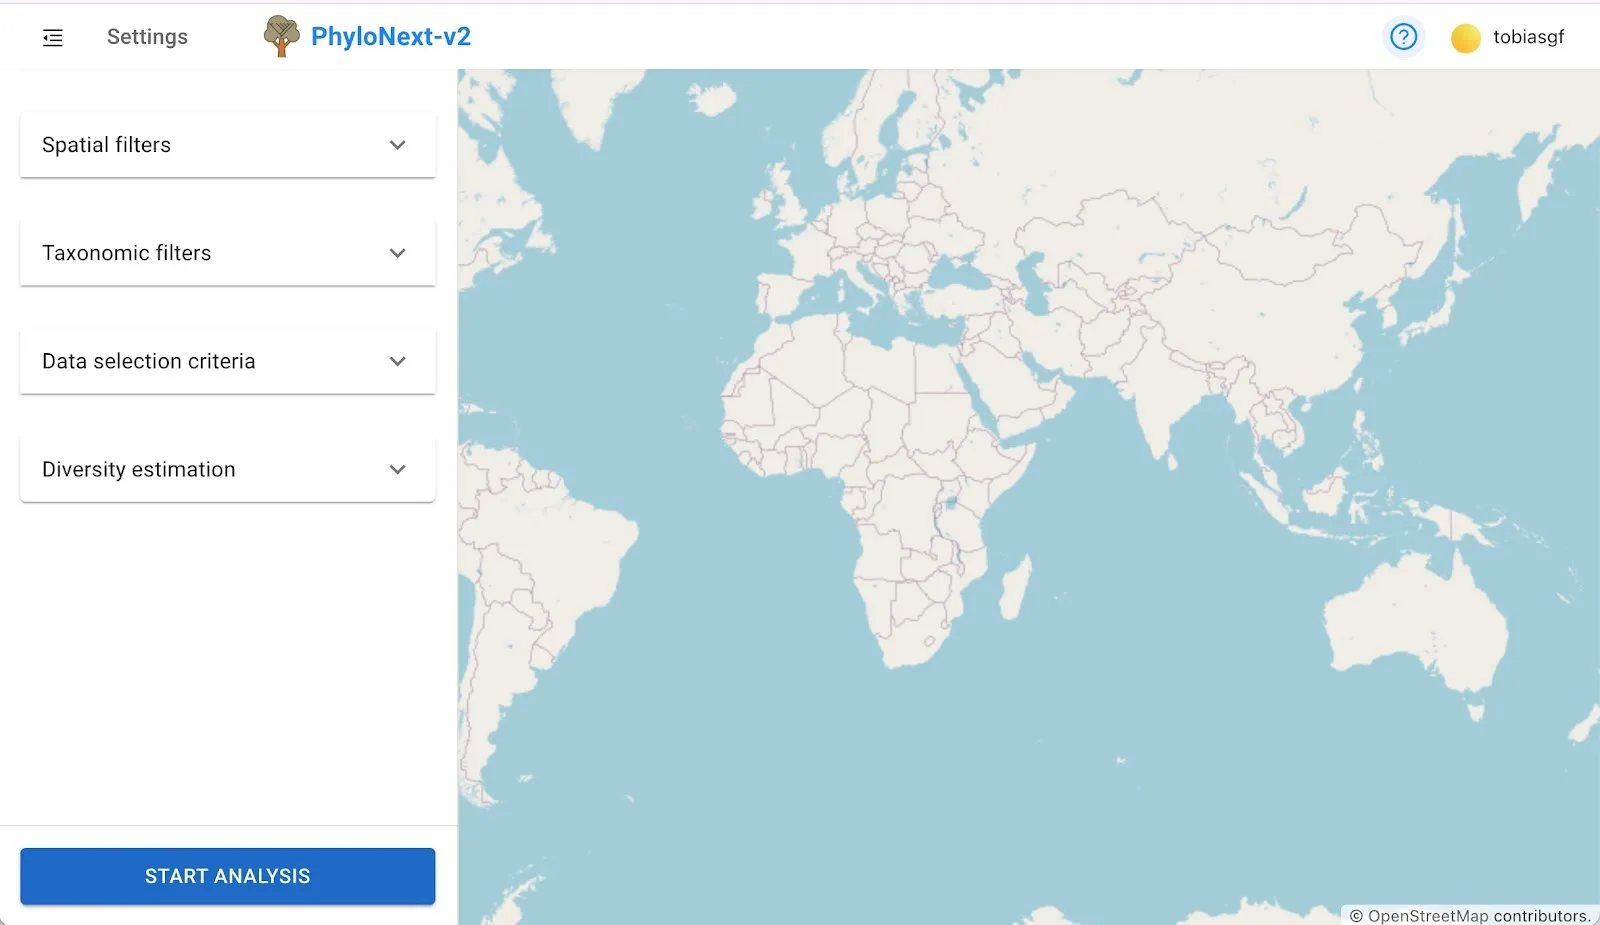
3. Navigating the user interface
The PhyloNext interface features a parameters panel on the left and a larger visualization panel on the right.
3.1. Model initiation (parameters panel)
Users configure their analysis by setting various parameters:
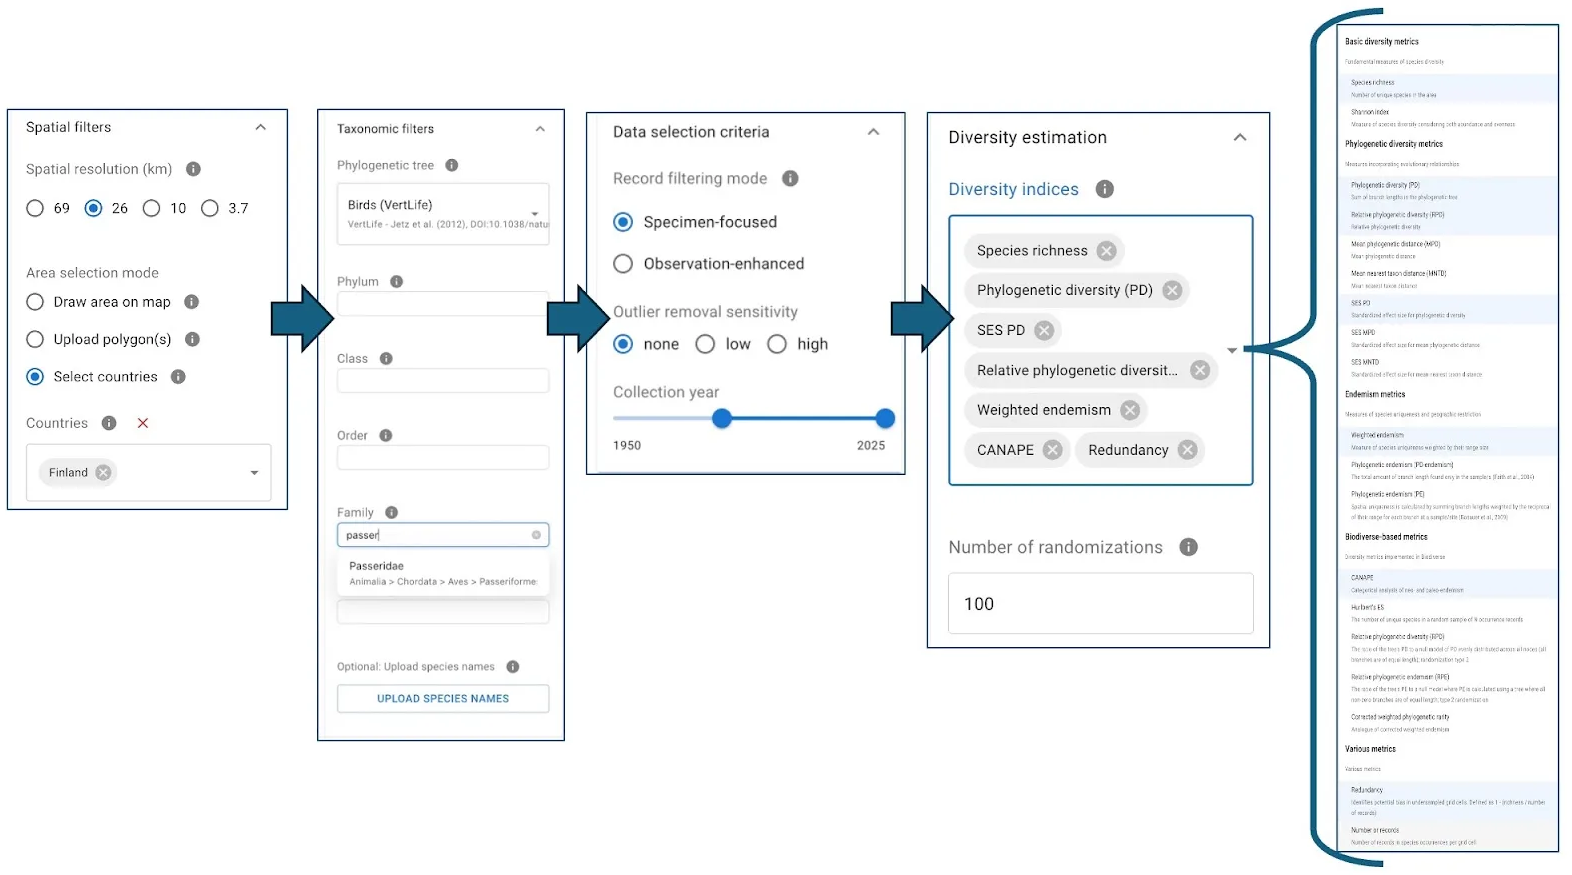
- Spatial filters & resolution: Define the area of interest by country names, uploaded polygons (shapefiles), or by drawing directly on the map. Select from four preset spatial resolution levels.
- Taxonomic filters:
- Select a primary phylogenetic tree as the basis for diversity calculations (curated trees for major taxa are available).
- Option to use subtrees from the Open Tree of Life.
- Further restrict taxonomic scope (e.g., to a single genus or family).
- Upload a custom list of species names.
- Data selection criteria:
- Specify the thoroughness of data filtering.
- Restrict to specimen-based occurrences or include human observations.
- Choose from three levels of sensitivity for outlier removal.
- Define a specific year range for occurrence data.
- Diversity indices: Select from approximately 20 different diversity estimates. For metrics requiring randomization (e.g., metrics relying on estimation of standardized effect size), specify the number of randomizations.
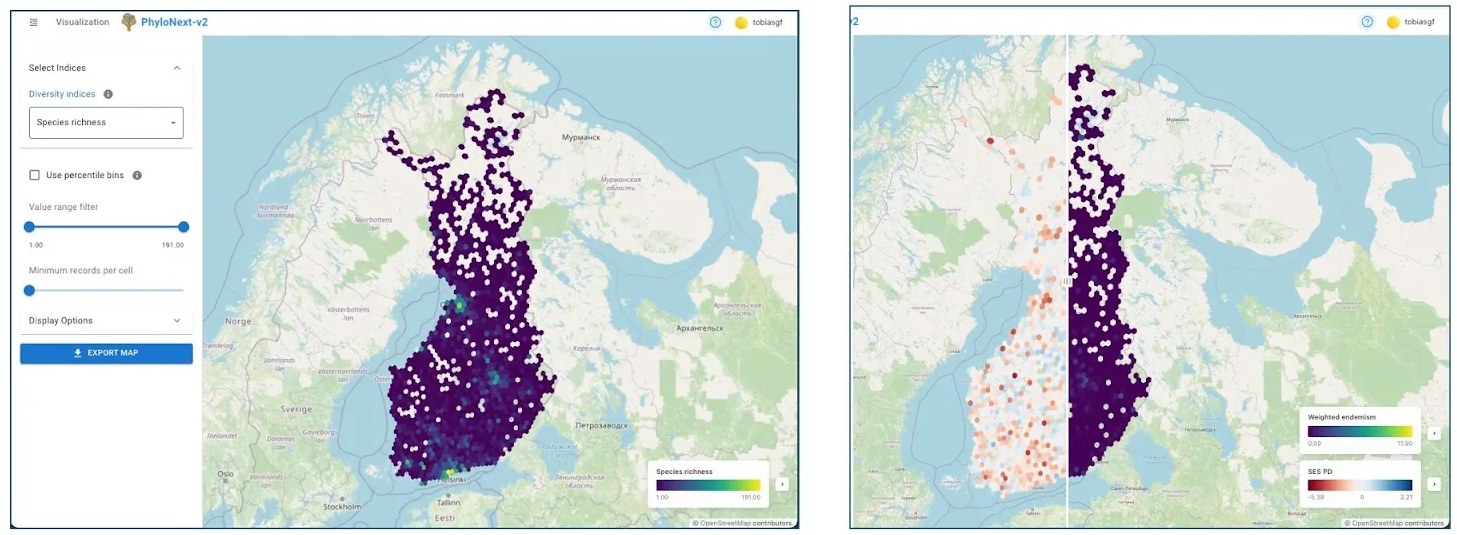
3.2. Results visualization (map window)
Once an analysis is complete (which may take some minutes depending on data volume and selected metrics), results are displayed interactively:
- Spatial hexagon maps: Diversity indices are visualized as color-scaled spatial hexagons covering the area of interest at the chosen resolution.
- Metric selection: If multiple indices were calculated, users can select which ones to display.
- Comparative view: When two diversity indices are selected, a swipe/slider tool allows for direct visual comparison on the map.
- Customization options:
- Display percentile bins instead of absolute index values.
- Set upper and lower cut-off values for the displayed range.
- Define a minimum number of records per cell for an area to be included in the visualization.
- Export: The map view can be exported as a PNG image file, including legends.
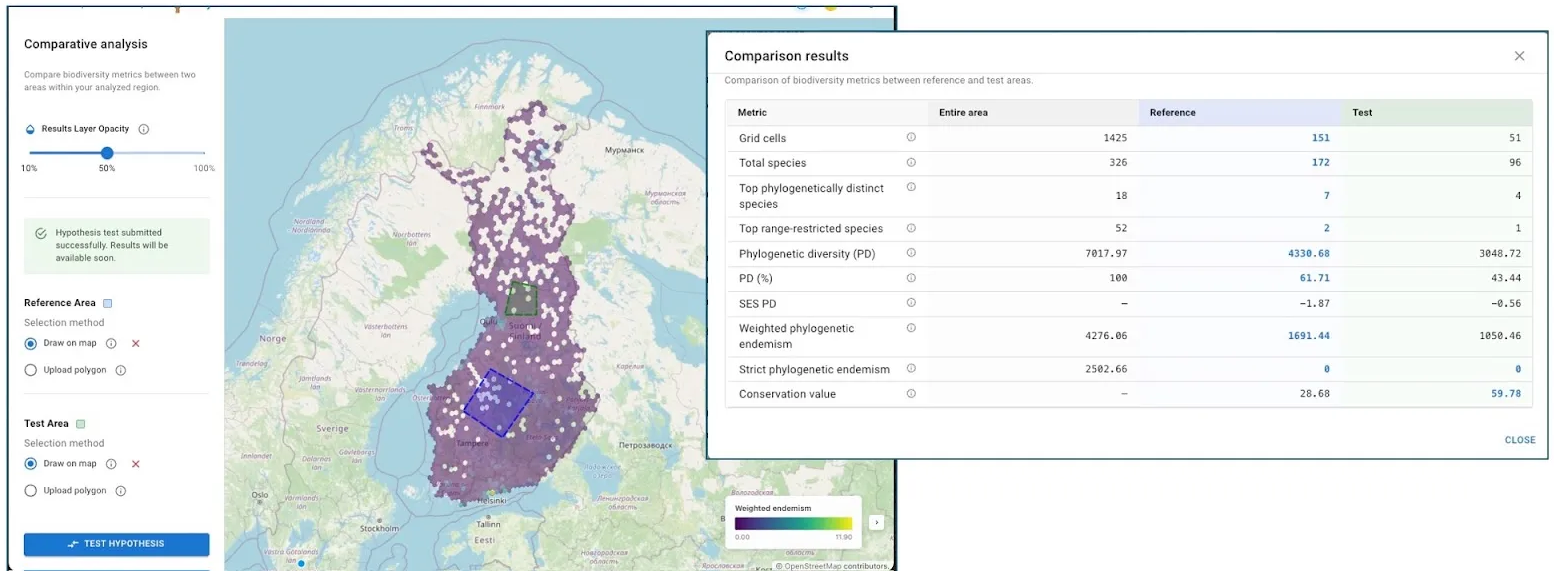
3.3. Comparative analyses
After an initial run, users can access a Comparison module (currently in the test stage):
- Define a reference area and a test area by uploading polygons or drawing on the map (both areas must be within the original analysis extent).
- The “Test Hypotheses” function calculates indices for both defined areas.
- Results are presented in a table of essential metrics, facilitating straightforward comparison.
- This feature is a step towards tools that could, for example, help assess which of several potential new protected areas would most effectively augment existing conservation networks.
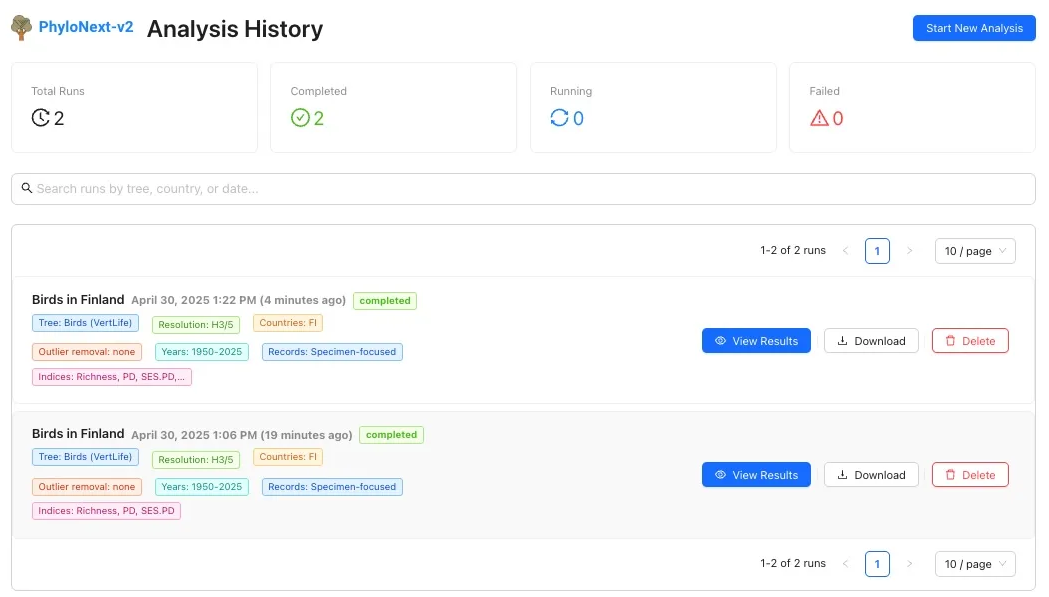
3.4. User area & analysis history
Logged-in users have access to their personal analysis history:
- Review parameters and status of previous runs.
- Re-visualize results from successful analyses.
- Download a comprehensive set of output files for completed runs.
- Delete past analysis runs.
4. Outputs and downloads
PhyloNext generates a downloadable ZIP archive containing all outputs in interoperable formats, ensuring data can be used in other GIS software or analysis pipelines. The archive typically includes:
- Filtered occurrence data:
- Aggregated species counts (e.g.,
aggregated_counts.parquet). - The subset of the phylogenetic tree used in the analysis (e.g.,
phylogenetic_tree.nex). - Dataset keys for source data (e.g.,
dataset_keys.tsv).
- Aggregated species counts (e.g.,
- Spatial biodiversity metrics:
- Tabular formats (e.g.,
diversity_estimates.txt- CSV). - Geospatial formats (e.g.,
diversity_estimates.geojson,diversity_estimates.gpkg) for seamless GIS integration.
- Tabular formats (e.g.,
- Species-specific metrics:
- Measures of evolutionary distinctiveness and range restrictiveness (degree of endemism) (e.g.,
species_originalities_and_ranges.txt). These are valuable for assessing each species’ contribution to community originality.
- Measures of evolutionary distinctiveness and range restrictiveness (degree of endemism) (e.g.,
- Area-comparison outputs (if applicable):
- Numerical indices of conservation value across regions (e.g.,
HypTest_diversity.json,HypTest_diversity.txt). - GeoJSON files for reference and test polygons.
- Numerical indices of conservation value across regions (e.g.,
- Reproducibility files:
- Complete log files for each pipeline step (in
logs/). - A summary of execution parameters (
pipeline_parameters.json). - Execution trace, timeline, and report (in
pipeline_info/). - DOIs of the datasets included in the analysis.
- Complete log files for each pipeline step (in
Example directory structure in download:
pipeline_info/Execution_trace_[timestamp].txtExecution_timeline_[timestamp].htmlExecution_report_[timestamp].html
logs/pipeline_parameters.jsonnextflow.log(overall pipeline execution log)- Multiple files with verbose output for each pipeline step
01.Occurrence_subset/aggregated_counts.parquetphylogenetic_tree.nexdataset_keys.tsv
02.Diversity_estimates/diversity_estimates.gpkgspecies_originalities_and_ranges.txtdiversity_estimates.txtdiversity_estimates.geojson
03.Hypothesis_tests/(if comparative analysis was run)HypTest_diversity.jsonHypTest_diversity.txtHypTest_species_originalities.txtPoly_reference.geojsonPoly_test.geojson
5. Important considerations for interpretation
- Data quality and bias: Results directly reflect the quality and completeness of underlying occurrence data. Be aware of potential biases towards well-sampled regions or taxonomic groups. The “Number of records” and “Redundancy” metrics (available in outputs and as sliders in the UI) should be consulted to identify potentially undersampled areas before making conservation decisions.
- Phylogenetic tree dependence: Diversity estimates can vary depending on the selected phylogenetic tree, which may contain topological uncertainties or missing taxa. Using different trees (e.g., various versions of the synthetic phylogeny from the Open Tree of Life) may yield different results.
- Standardized effect size (SES) metrics: Interpret SES metrics cautiously, considering both the magnitude of the effect size and the overall spatial extent. Results are also dependent on the number of randomizations chosen; higher numbers provide more robust significance tests but increase runtime.
- Holistic approach to biodiversity assessment: No single metric can capture all facets of biodiversity. Conservation decisions should integrate multiple metrics (taxonomic, phylogenetic, endemism-based, etc.) to comprehensively identify areas of biological importance. For instance, researchers can use traditional measures like species richness alongside phylogenetically-informed metrics (PD, MPD) to identify evolutionarily unique communities. Conservation planners can leverage endemism metrics and CANAPE analyses to prioritize areas with rare evolutionary history.
6. License
This project is licensed under the MIT License.
7. References
[1] Mikryukov V, Abarenkov K, Jeppesen TS, Schigel D, Frøslev T (2024) Prototype Biodiversity Digital Twin: Phylogenetic Diversity. Research Ideas and Outcomes 10: e124988. DOI:10.3897/rio.10.e124988
[2] Mikryukov V, Abarenkov K, Laffan S, Robertson T, McTavish EJ, Jeppesen TS, Waller J, Blissett M, Kõljalg U, Miller JT (2024). PhyloNext: A pipeline for phylogenetic diversity analysis of GBIF-mediated data. BMC Ecology and Evolution, 24(1), 76. DOI:10.1186/s12862-024-02256-9